Collecting and Analyzing Customer Data
How to collect customer data?
The questions that customer analytics will help you answer are nearly endless, and those questions will help every department within your company. With customer analytics, you’ll be able to build more personalized, timely marketing campaigns.
Customer journey analytics can also help your sales team understand your customers’ buying process. That knowledge can help them reduce your sales cycle.
Your product team can use customer analytics to build a better product by uncovering what features your customers love and what they don’t like.
3 ways to analyze customer success
Not every organization will have the same customer success metrics to measure customer-centricity. However, the three most important customer-centric metrics that should be carefully monitored are churn rate, Net Promoter Score and customer lifetime value (CLV).
1. Churn rate
Acquiring new customers is becoming more difficult. Therefore, more companies are investing in keeping existing customers instead of trying to find new ones. Here’s why:
- Acquiring new customers can cost up to 5x more than keeping existing customers
- A 2% increase in customer retention has the same effect on profits as cutting costs by 10%
- On average, companies lose approx. 10% of its customer base each year (also known as customer churn)
Companies with a high retention rate grow faster.
The key to improving retention rates is to understand why people leave, and why people remain customers.
Call Miner’s Churn Index Report reveals that $35.3 billion is associated with unplanned switching to a different brand due to triggers that could have been avoided. For example, customers were more likely to leave a brand if:
- Knowledgeable customer support, or super agents, can address customer needs by emphatically listening and addressing an issue then solving it promptly
- Companies lacked automated self-service channels, such as a knowledge base, to solve issues on their own
- Customers not feeling rewarded for their loyalty while new customers receive onboarding benefits and bonuses
Once known, you can calculate churn rate by measuring the number of customers who left in the last 12 months divided by the average number of total customers (during the same period).
2. Net Promoter Score
Are your customers happy? How do you measure customer happiness?
The answer is through NPS.
NPS, or Net Promoter Score, focuses on uncovering customer loyalty by asking only one, simple question:
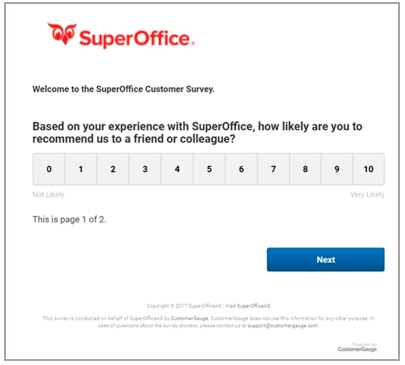
Each time a customer responds to this question, the answer is then segmented based on predefined criteria:
- Promoters (9-10): These people are in love with your product or service and are likely to refer you to potential buyers. The customers who rate you a 9 or 10 are repeat customers and will have a high customer lifetime value.
- Passives (7-8): These people who rate you a 7 or 8 are content with being a customer of your business, but are the most likely to switch to a competitor should they find a new or better product.
- Detractors (0-6): These people are not happy with your product or service and are likely to damage your brand reputation by sharing their negative experience with their friends, family and connections.
The more Promoters you have, the healthier your business. Simple, really?
And the fact that it’s simple to implement and measure makes the NPS a favorite with company boards and executive committees.
3. Customer lifetime value (CLV)
For a customer-centric business, the most valuable “asset” is their customer base.
If you’re investing in long-term relationships, you can calculate the “health” of the relationship with customer lifetime value or CLV.
CLV measures the amount of revenue a customer contributes to your business for as long as they are a paying customer. It starts with their first purchase and ends when they stop doing business with you.
To calculate CLV, add up the total revenue you have earned and multiply that with the length of the business relationship. Then, deduct the initial cost of acquiring them.
For example, if a customer spends $1,000 annually, and the average “lifetime” of a customer is 10 years, then you multiply $1,000 by 10 years ($10,000). Now, subtract the cost of acquisition (in this case, we’ll estimate $1,000), and the CLV is $9,000.
Not bad, right?
Calculating CLV helps you understand why it makes sense to invest in keeping your customers.
The Customer Lifetime Value Explained in more Detail
The customer service and retention teams can use customer analytics to predict and reduce churn.
If you’re not sure where to start with customer analytics, take some time to calculate your customer acquisition cost (CAC) and the lifetime value LTV of your customers.
Those numbers are often going to be the basis for many of the customer analytics questions that you have. For example, say you want to know where you should be spending the bulk of your advertising dollars. Basing that decision just on the number of customers who came in from a specific ad platform isn’t good enough. Maybe Facebook ads have given you a lot of customers, but if your CAC is high and the LTV is low on that platform, it could be a waste of money.
Qualitative Customer Data Analysis
Quantitative Customer Data Analysis